ml-a01-regression

Regression and Gradient Descent

1
2
import numpy as np
import matplotlib.pyplot as plt
1
2
3
4
5
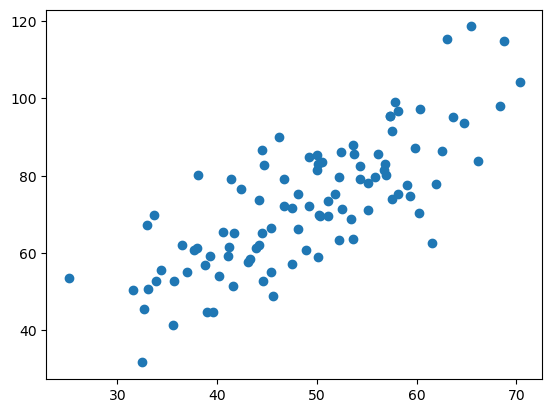
data = np.genfromtxt("gradient-descent-data.csv", delimiter=",")
x_data = data[:, 0]
y_data = data[:, 1]
plt.scatter(x_data, y_data)
plt.show()
1
2
3
4
5
6
7
8
9
10
11
12
13
14
15
16
17
18
19
20
21
# lost function
def compute_error(b, k, x_data, y_data):
total_error = 0
for i in range(0, len(x_data)):
total_error += (y_data[i] - (k * x_data[i] +b)) ** 2
return total_error/float(len(x_data)) / 2.0

# gradient descent
def gradient_descent_runner(x_data, y_data, b, k, lr, epochs):
# all data length
m = float(len(x_data))
# loop over epochs
for i in range(epochs):
b_grad = 0
k_grad = 0
for j in range(0, len(x_data)):
b_grad += (1/m) * ((k*x_data[j] +b) - y_data[j])
k_grad += (1/m) * x_data[j] * ((k * x_data[j] + b) - y_data[j])
b = b - (lr * b_grad)
k = k - (lr * k_grad)
return b, k
1
2
3
4
5
6
7
8
9
10
11
12
13
14
15
16
17
18
19
# lr learning rate
lr = 0.0001
#intercept
b = 0
#rake ratio
k = 0
#iteration numbers
epochs = 50

print("starting b={0}, k={1}, error = {2}".format(b, k, compute_error(b, k, x_data, y_data)))

b, k = gradient_descent_runner(x_data, y_data, b, k, lr, epochs)
print("Running...")

print("after {0} iterations b={1}, k={2}, error={3}".format(epochs, b, k, compute_error(b, k, x_data, y_data)))

plt.plot(x_data, y_data, 'b.')
plt.plot(x_data, k*x_data +b, 'r')
plt.show()

The output result:

1
2
3
4

starting b=0, k=0, error = 2782.5539172416056
Running...
after 50 iterations b=0.030569950649287983, k=1.4788903781318357, error=56.32488184238028

PS:
gradient-descent-data.csv

Sklearn

1
2
3
from sklearn.linear_model import LinearRegression
import numpy as np
import matplotlib.pyplot as plt
1
2
3
4
5
6
data = np.genfromtxt("gradient-descent-data.csv", delimiter=",")
x_data = data[:, 0]
y_data = data[:, 1]
plt.scatter(x_data,y_data)
plt.show()
print(x_data.shape)

(100,)

1
2
3
4
x_data = data[:, 0, np.newaxis]
y_data = data[:, 1, np.newaxis]
model = LinearRegression()
model.fit(x_data,y_data)
LinearRegression()
In a Jupyter environment, please rerun this cell to show the HTML representation or trust the notebook.
On GitHub, the HTML representation is unable to render, please try loading this page with nbviewer.org.
1
2
3
plt.plot(x_data,y_data,'b.')
plt.plot(x_data, model.predict(x_data), 'r')
plt.show()